── Attaching core tidyverse packages ──────────────────────── tidyverse 2.0.0 ──
✔ dplyr     1.1.2     ✔ readr     2.1.4
✔ forcats   1.0.0     ✔ stringr   1.5.0
✔ lubridate 1.9.2     ✔ tibble    3.2.1
✔ purrr     1.0.1     ✔ tidyr     1.3.0
── Conflicts ────────────────────────────────────────── tidyverse_conflicts() ──
✖ dplyr::filter() masks stats::filter()
✖ dplyr::lag()    masks stats::lag()
ℹ Use the conflicted package (<http://conflicted.r-lib.org/>) to force all conflicts to become errors
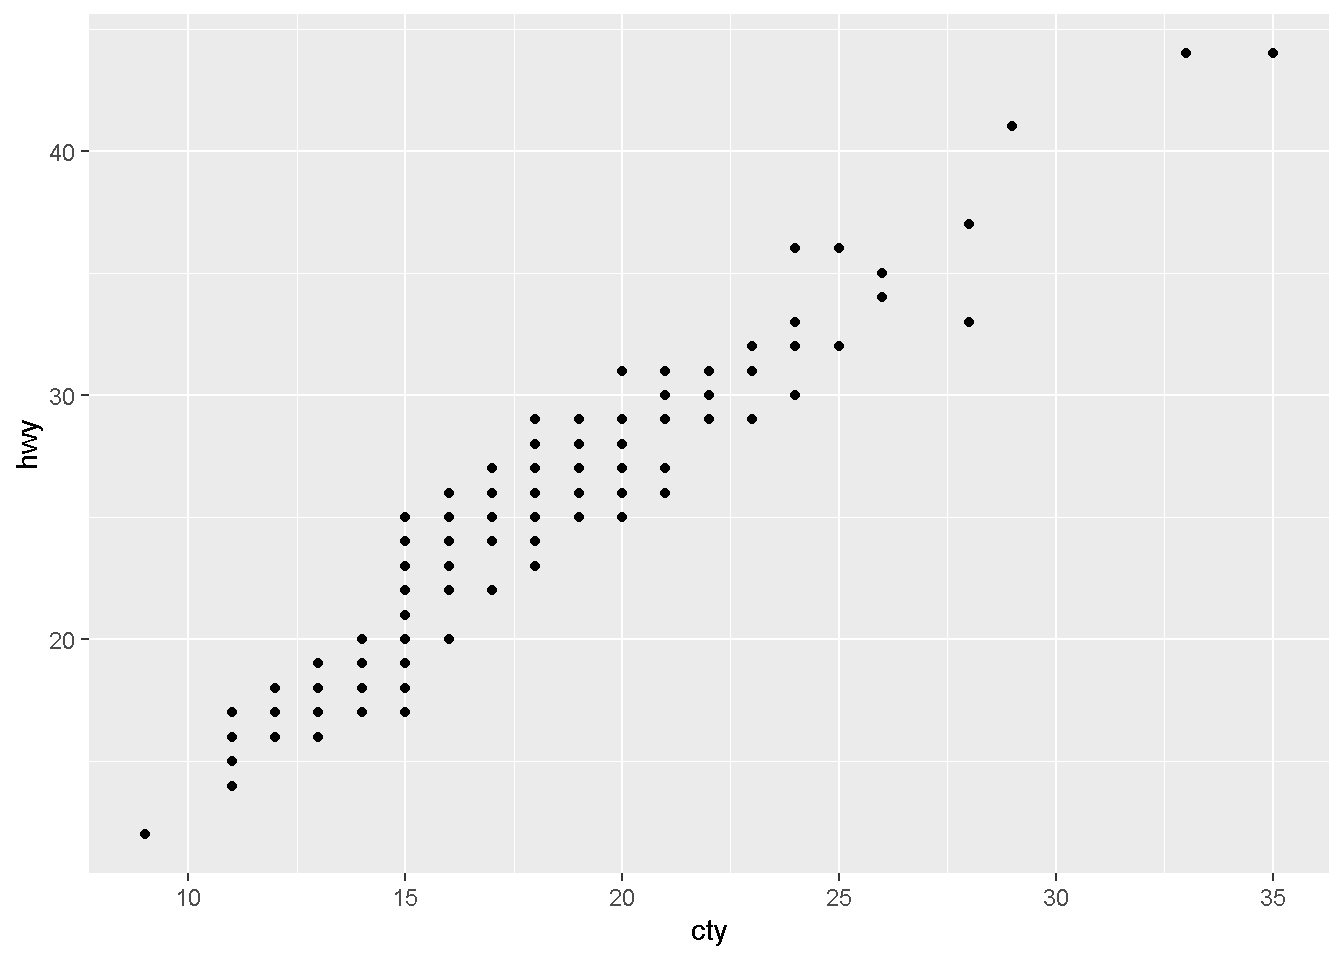
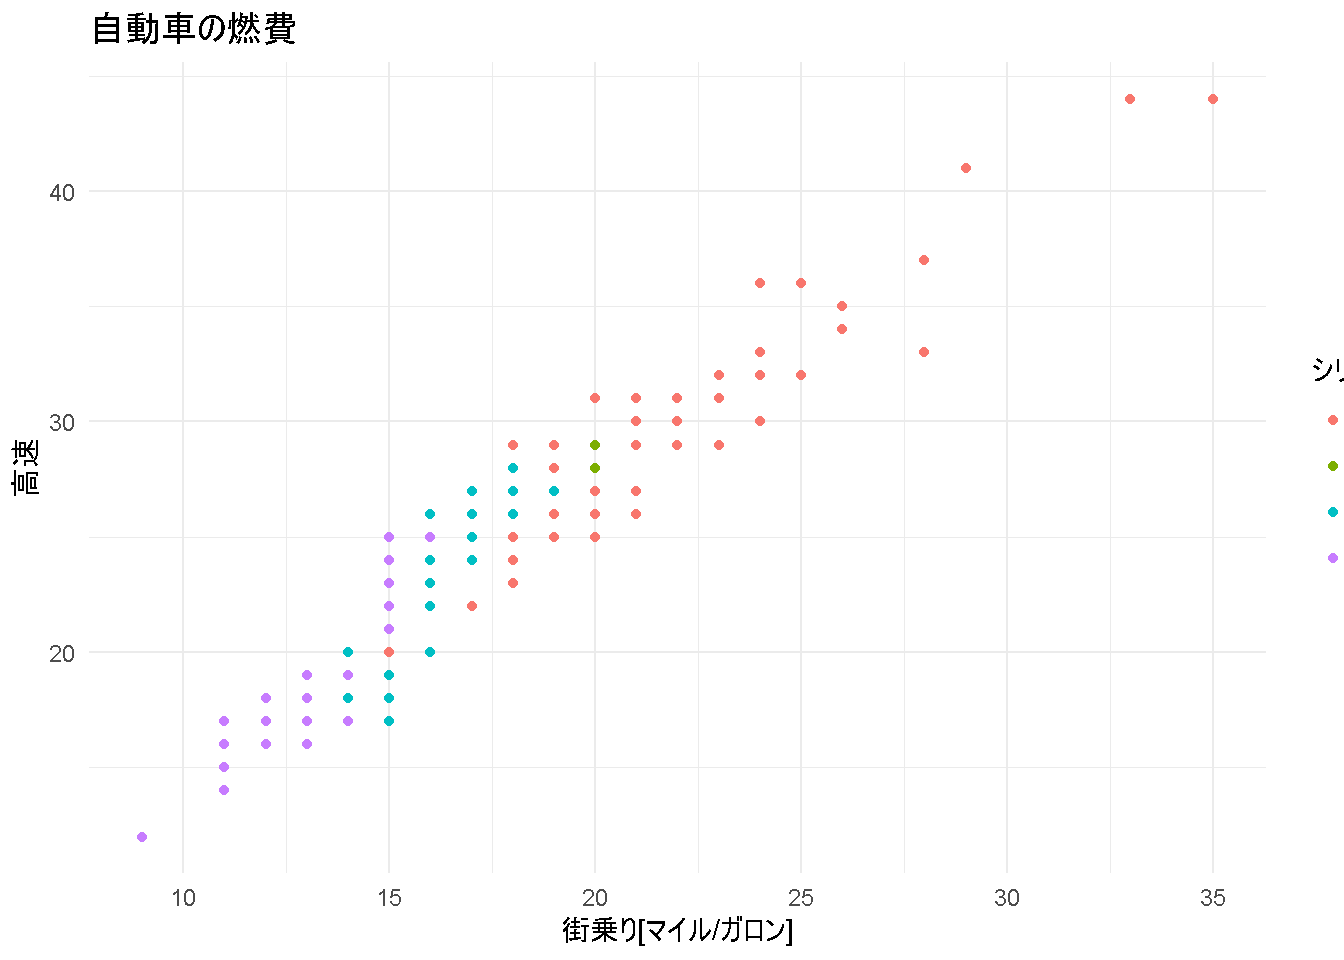
ggplot(data = mpg) +
  geom_point(mapping = aes(x=cty, y=hwy, color=as.factor(cyl))) +
  labs(title = "自動車の燃費", x = "街乗り[マイル/ガロン]", y = "高速") +
  scale_color_discrete(name="シリンダー数") +
  theme_minimal() +
  theme(legend.box.margin = margin(0,-50,0,0))