それでは、ここでは事前設定されたテーマをグラフに適応していきましょう。
ここでは、msleepデータのグラフに対して操作をおこなっていきます。
── Attaching core tidyverse packages ──────────────────────── tidyverse 2.0.0 ──
✔ dplyr     1.1.2     ✔ readr     2.1.4
✔ forcats   1.0.0     ✔ stringr   1.5.0
✔ ggplot2   3.4.2     ✔ tibble    3.2.1
✔ lubridate 1.9.2     ✔ tidyr     1.3.0
✔ purrr     1.0.1
── Conflicts ────────────────────────────────────────── tidyverse_conflicts() ──
✖ dplyr::filter() masks stats::filter()
✖ dplyr::lag()    masks stats::lag()
ℹ Use the conflicted package (<http://conflicted.r-lib.org/>) to force all conflicts to become errors
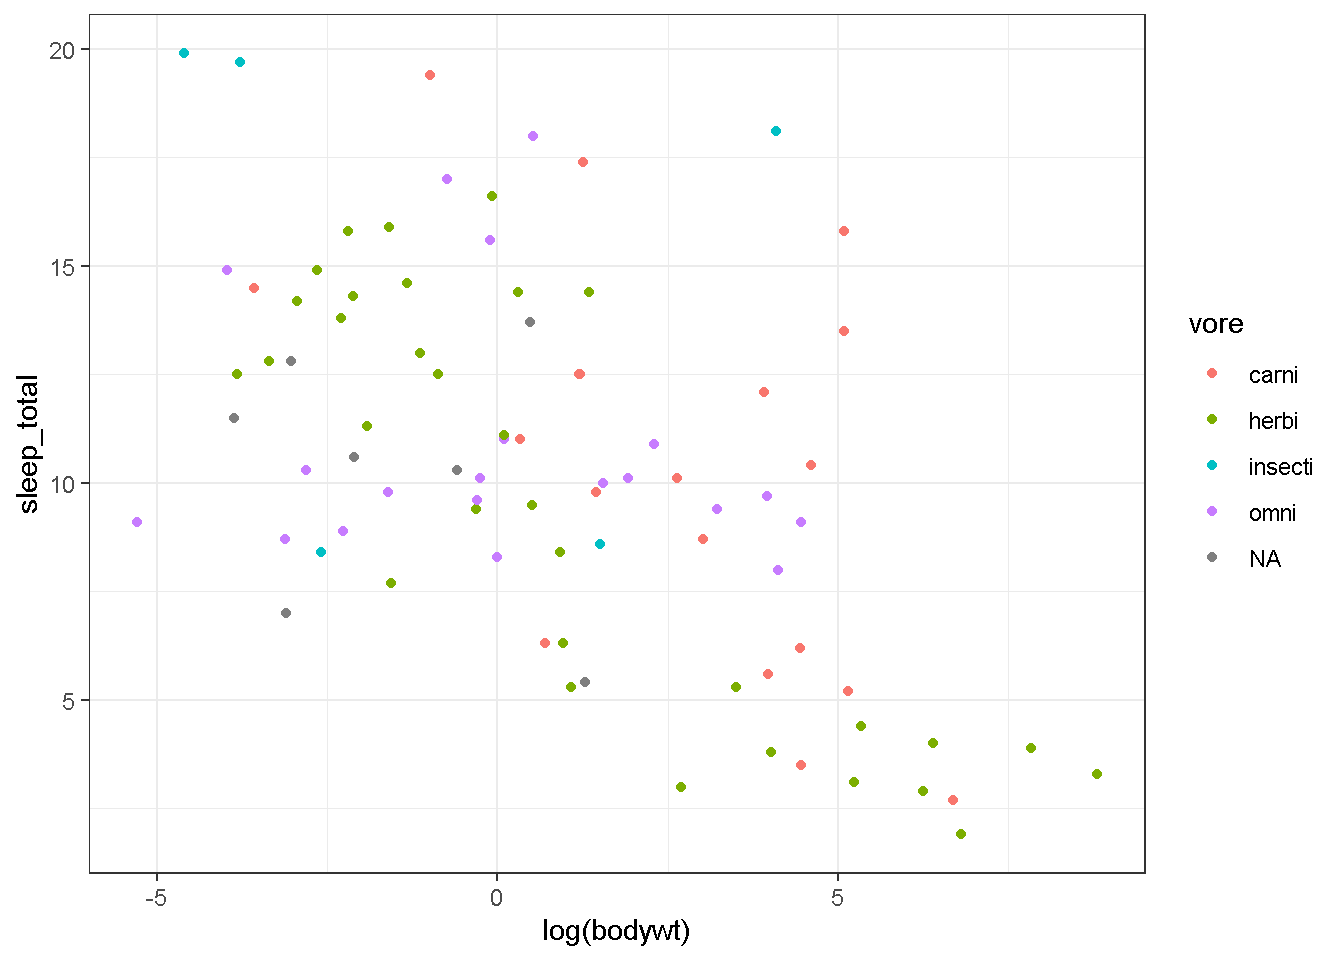
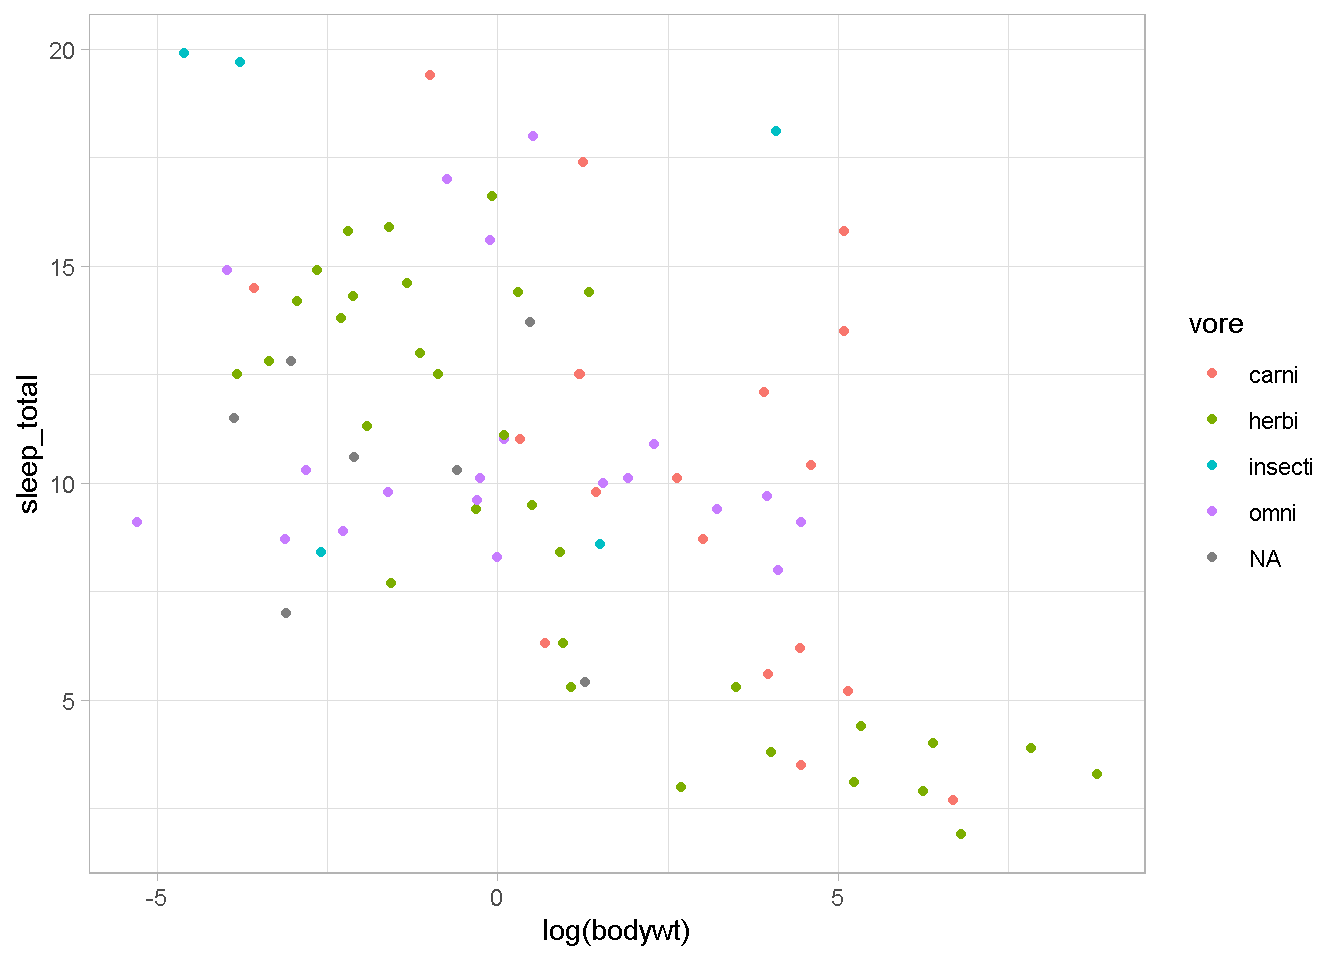
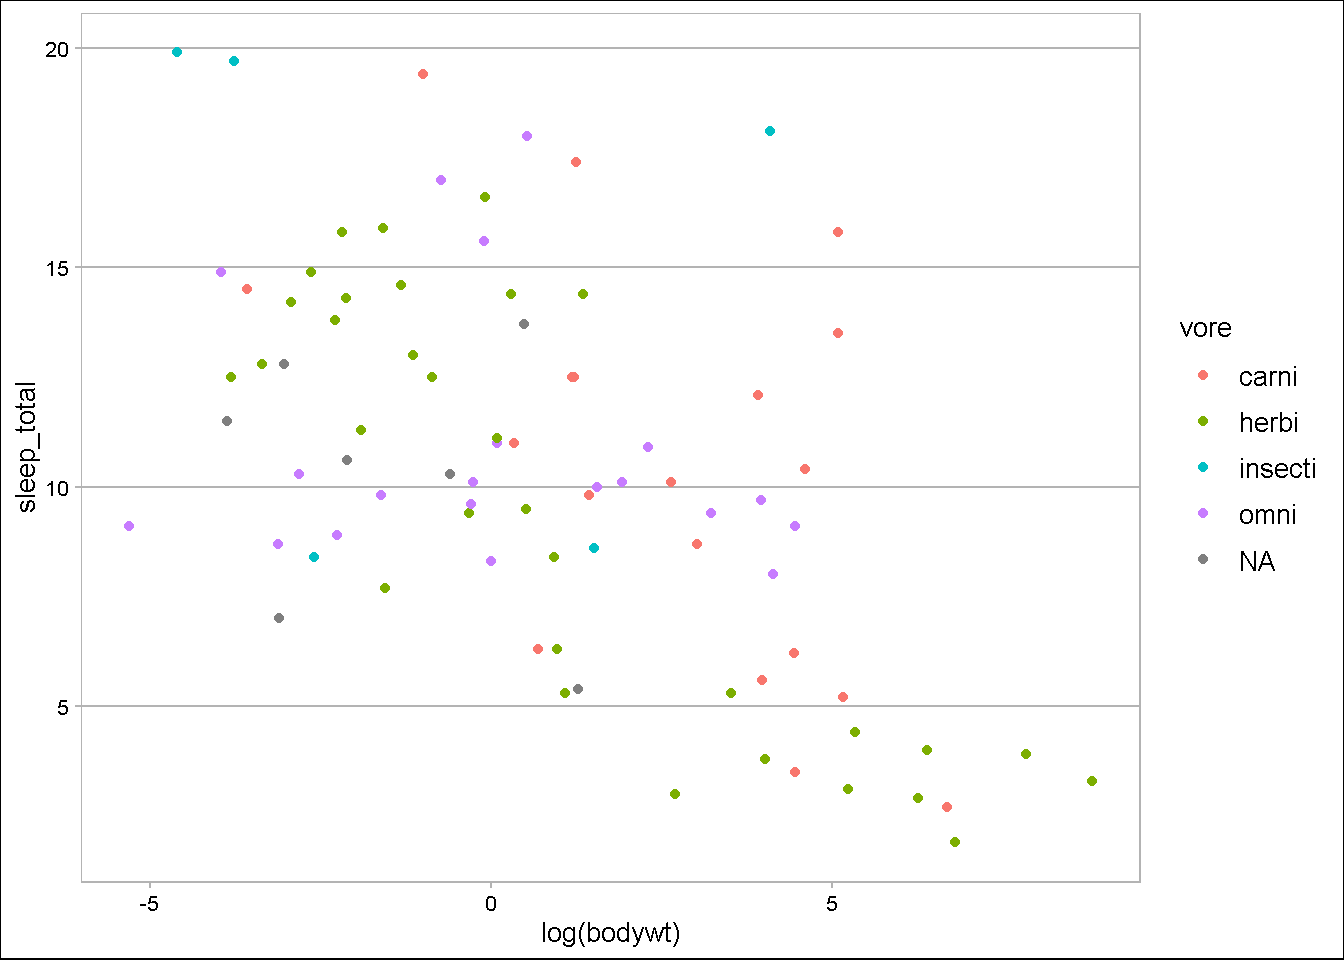
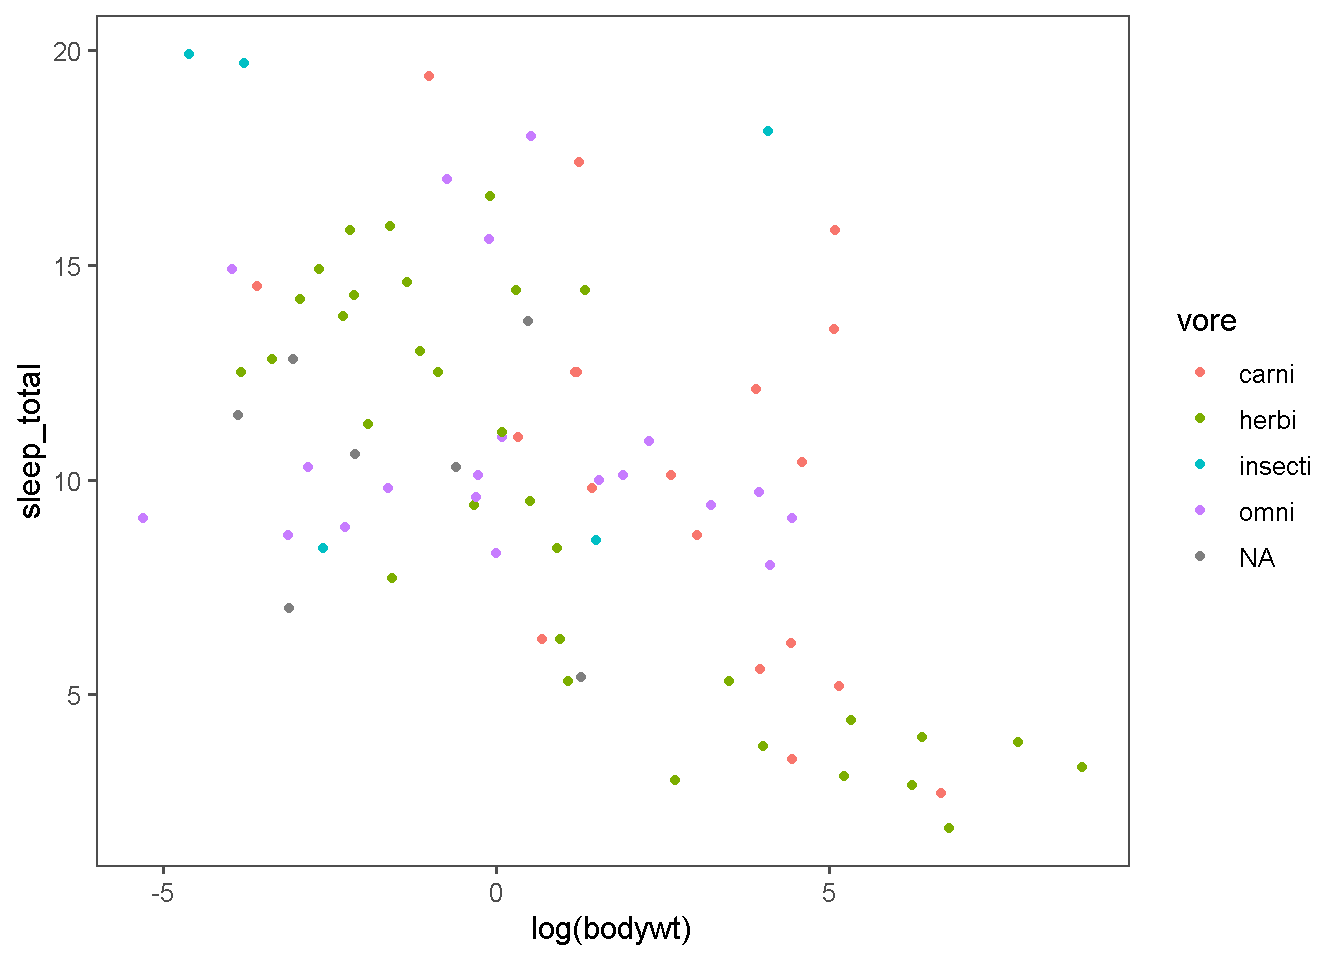
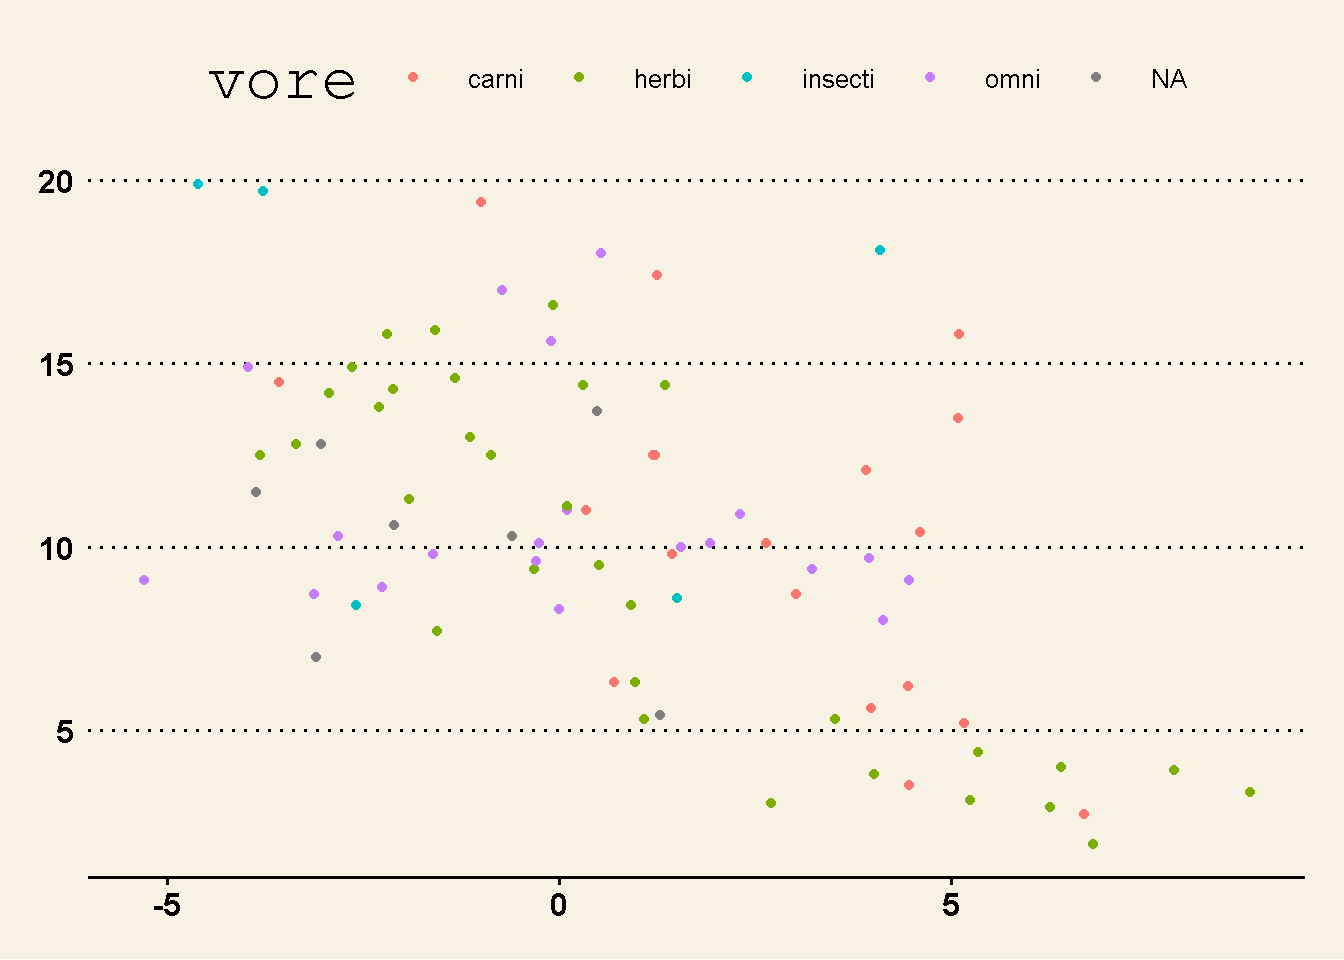
gg <- ggplot(msleep)+
  geom_point(aes(x=log(bodywt),y=sleep_total,color=vore))

gg
まず。デフォルトの見た目はこんな感じです。 「それなり」ですが、もっとよくできます。
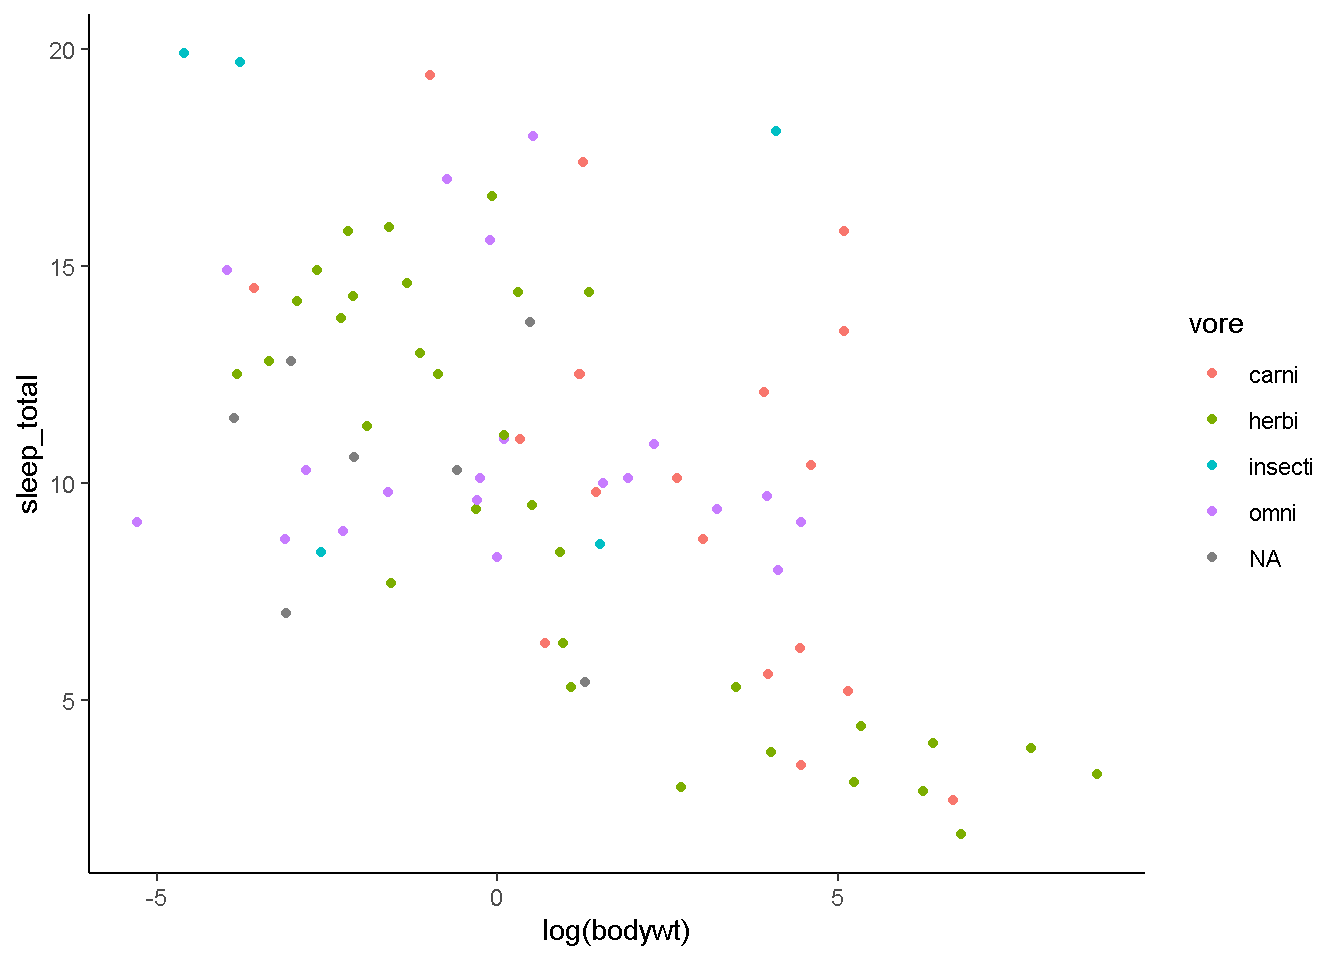
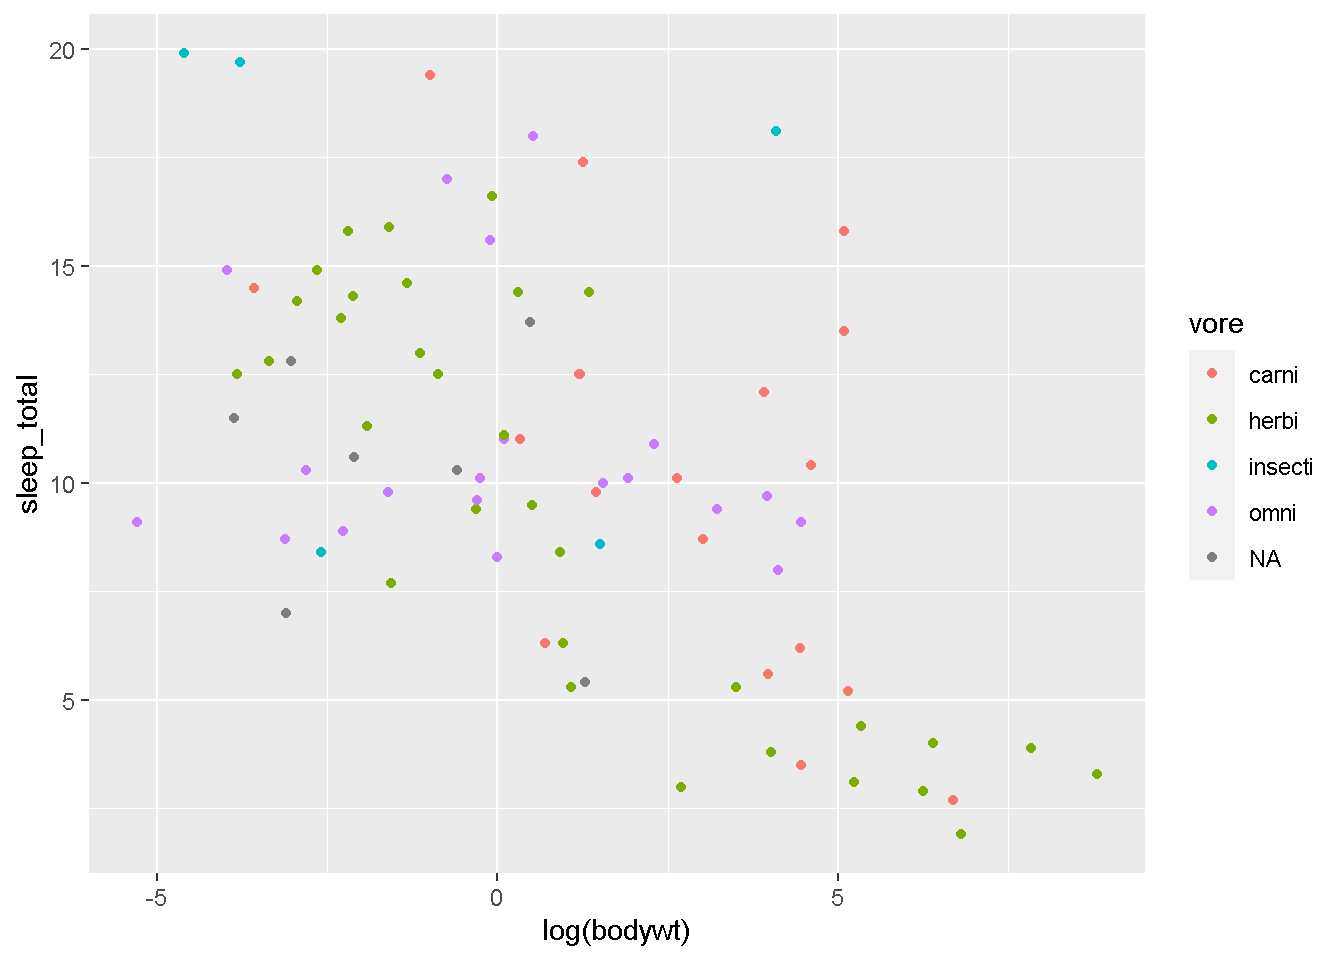
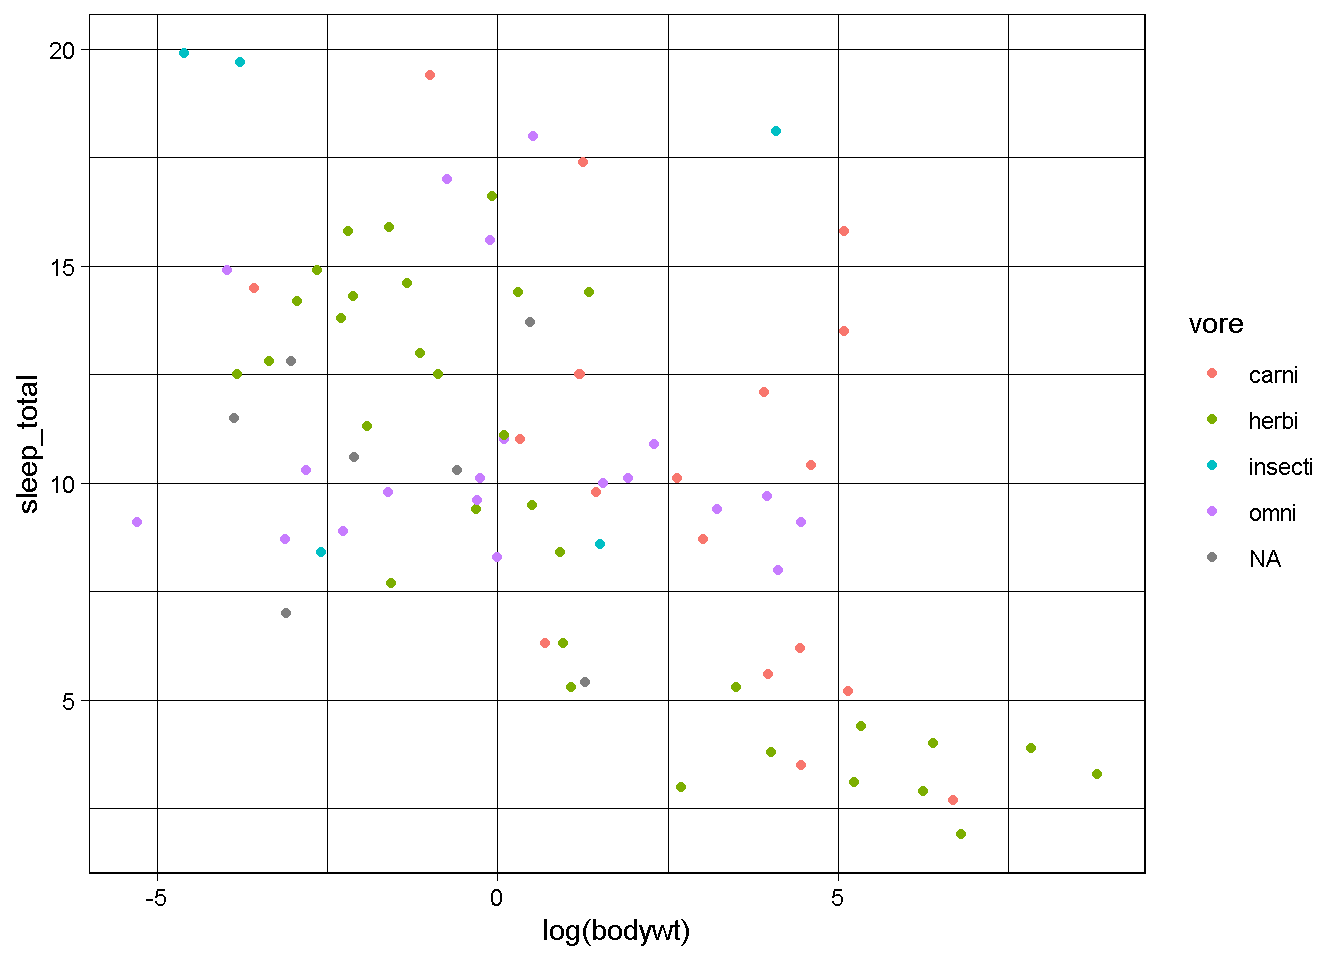
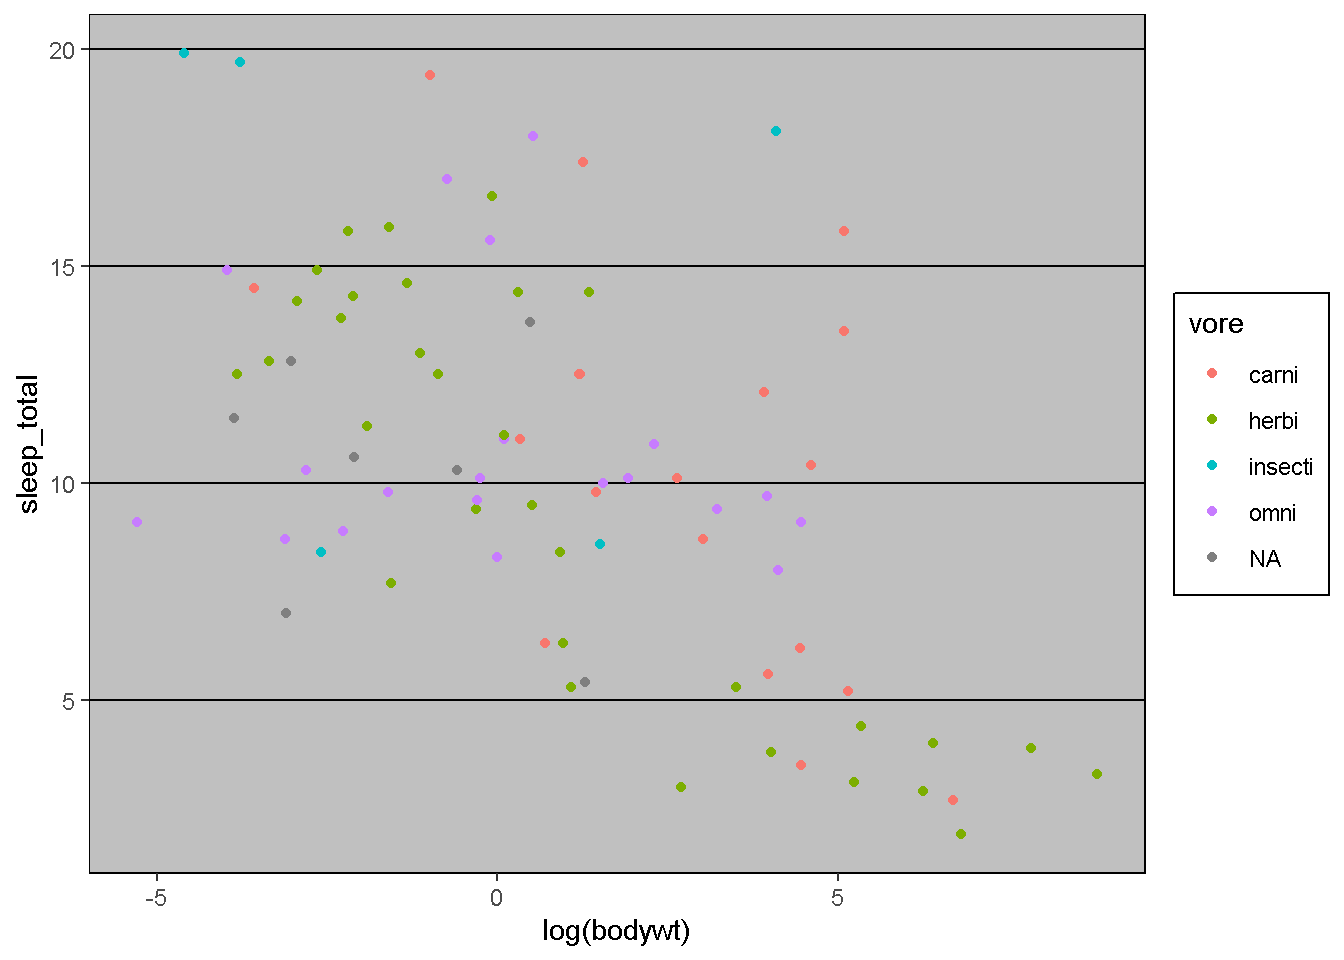
ggplot2にある、theme_xxxという関数群を今回作成したgg変数に足してあげて描画すると、
こんな感じでグラフがかわります!
いかがでしょうか?
これらのtheme_xxxは、
starting httpd help server ... done
のアーギュメントの値をデフォルトで設定されているものにして、グラフ全体の見た目を整えることことができます。 他に、このtheme関連の関数を提供することが目的のパッケージもあったりします。
install.packages("ggthemes")
Warning: package 'ggthemes' was built under R version 4.3.2
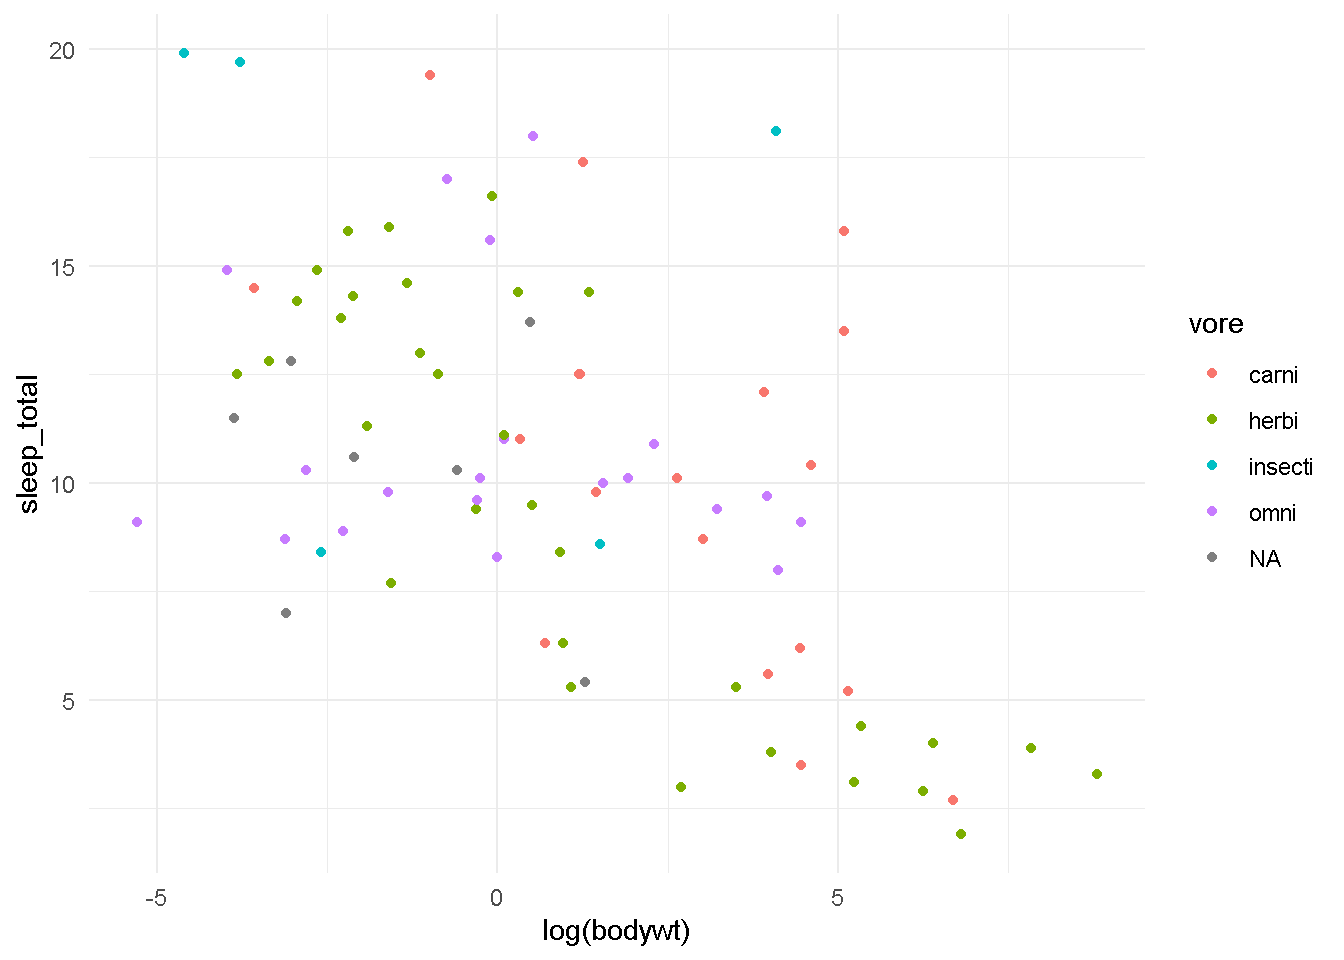
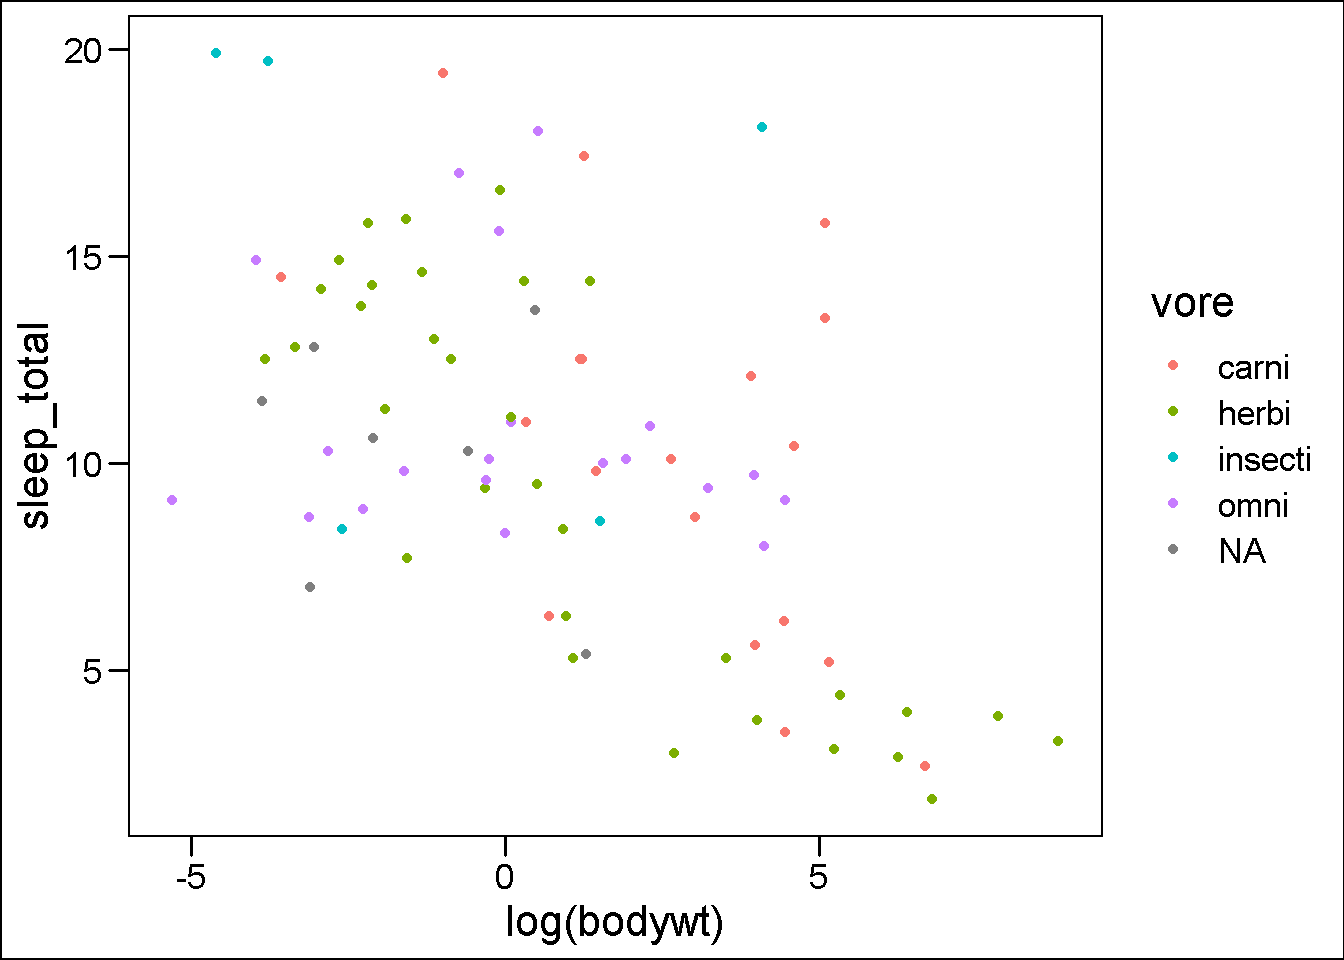
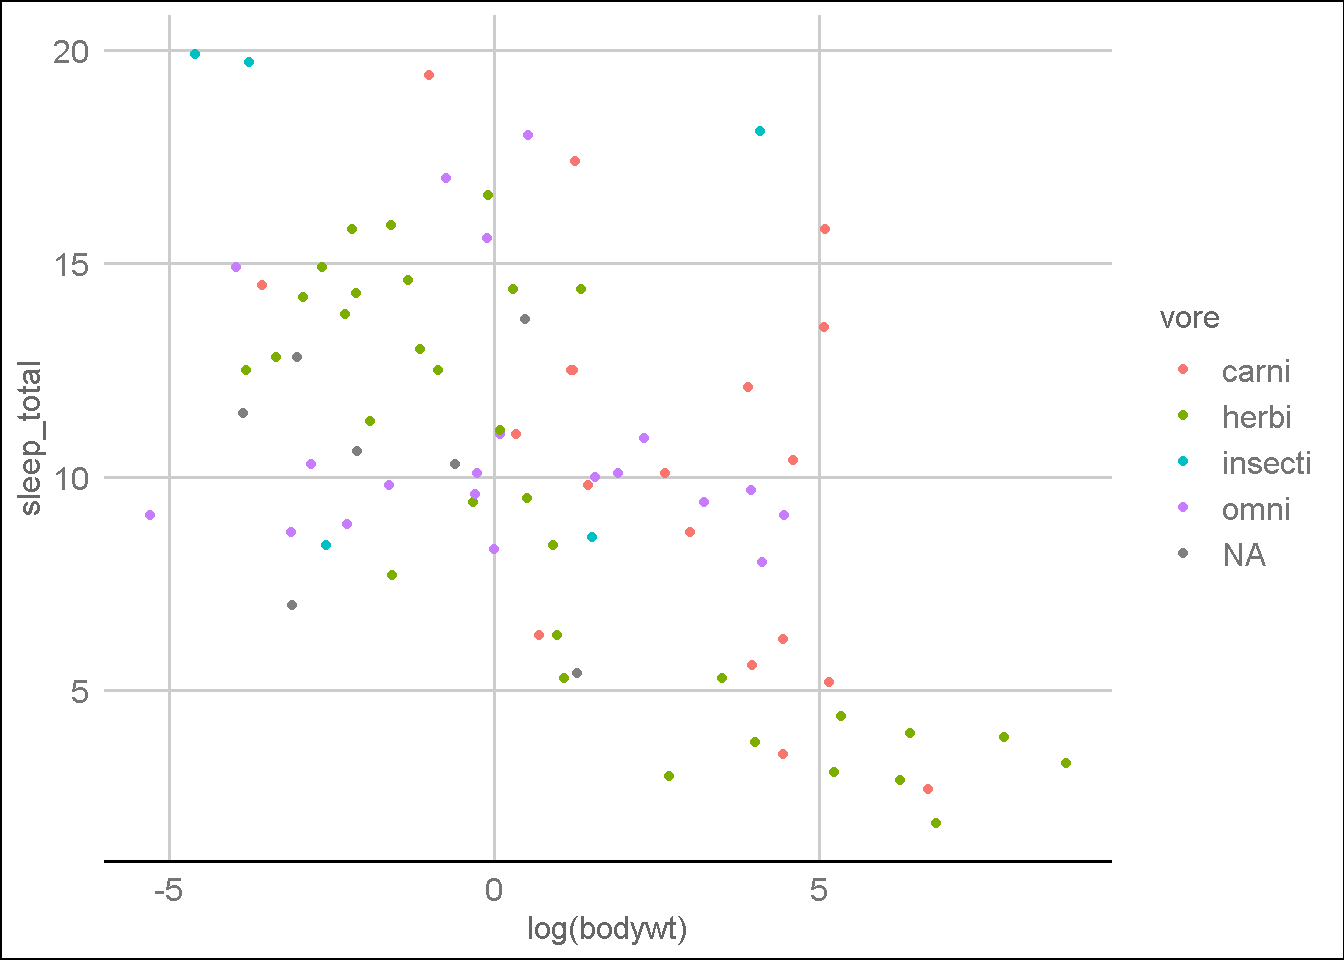
gg + ggthemes::theme_base()
gg + ggthemes::theme_calc()
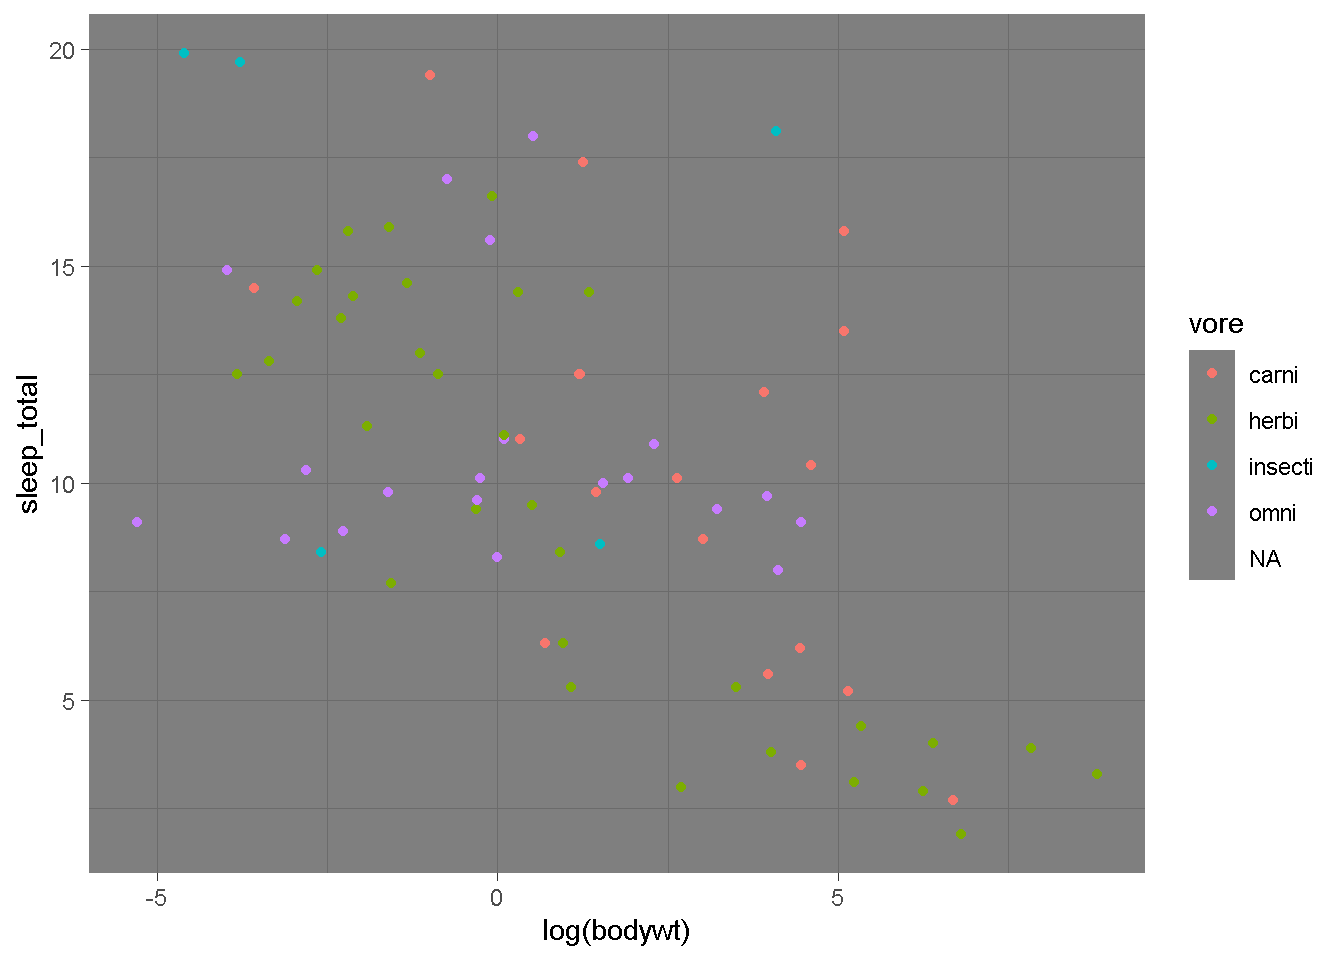
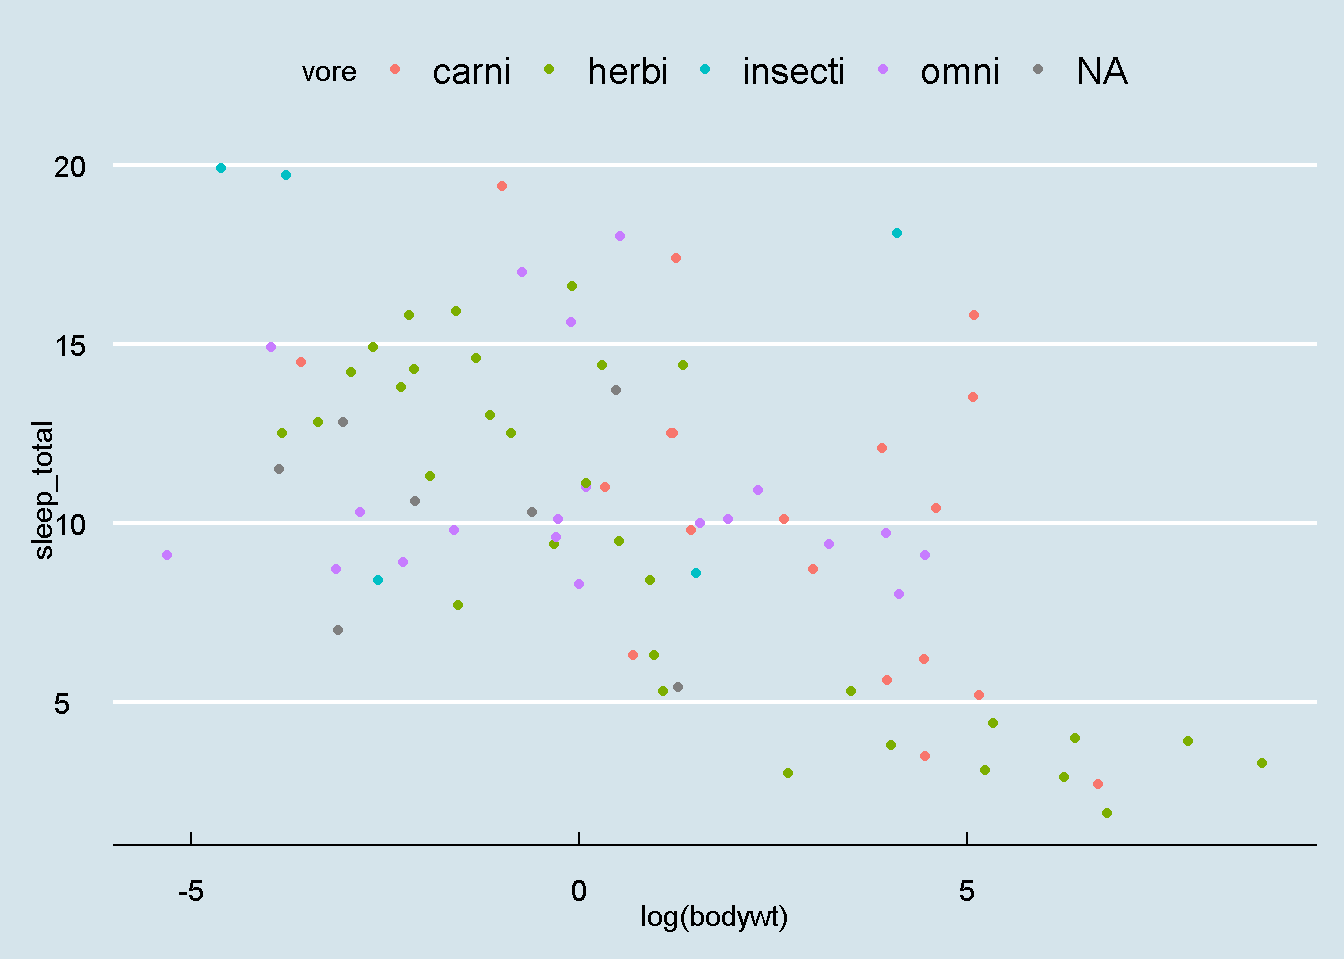
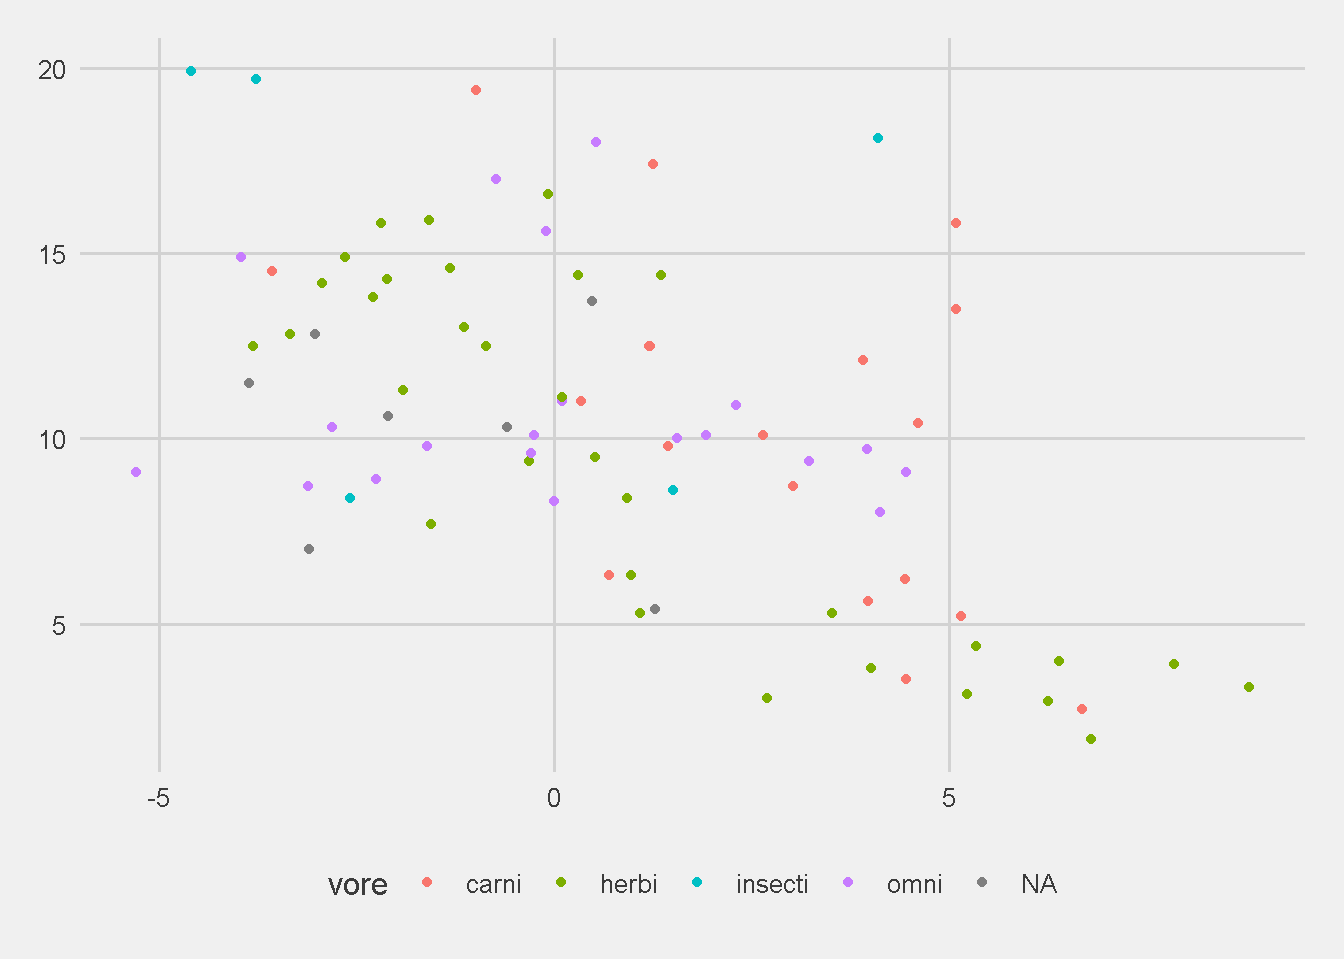
gg + ggthemes::theme_economist() #Economist(雑誌)とにたテーマ
gg + ggthemes::theme_economist_white()
gg + ggthemes::theme_excel() #説明分がひどいです・・・「絶対につかわないで」
gg + ggthemes::theme_few()
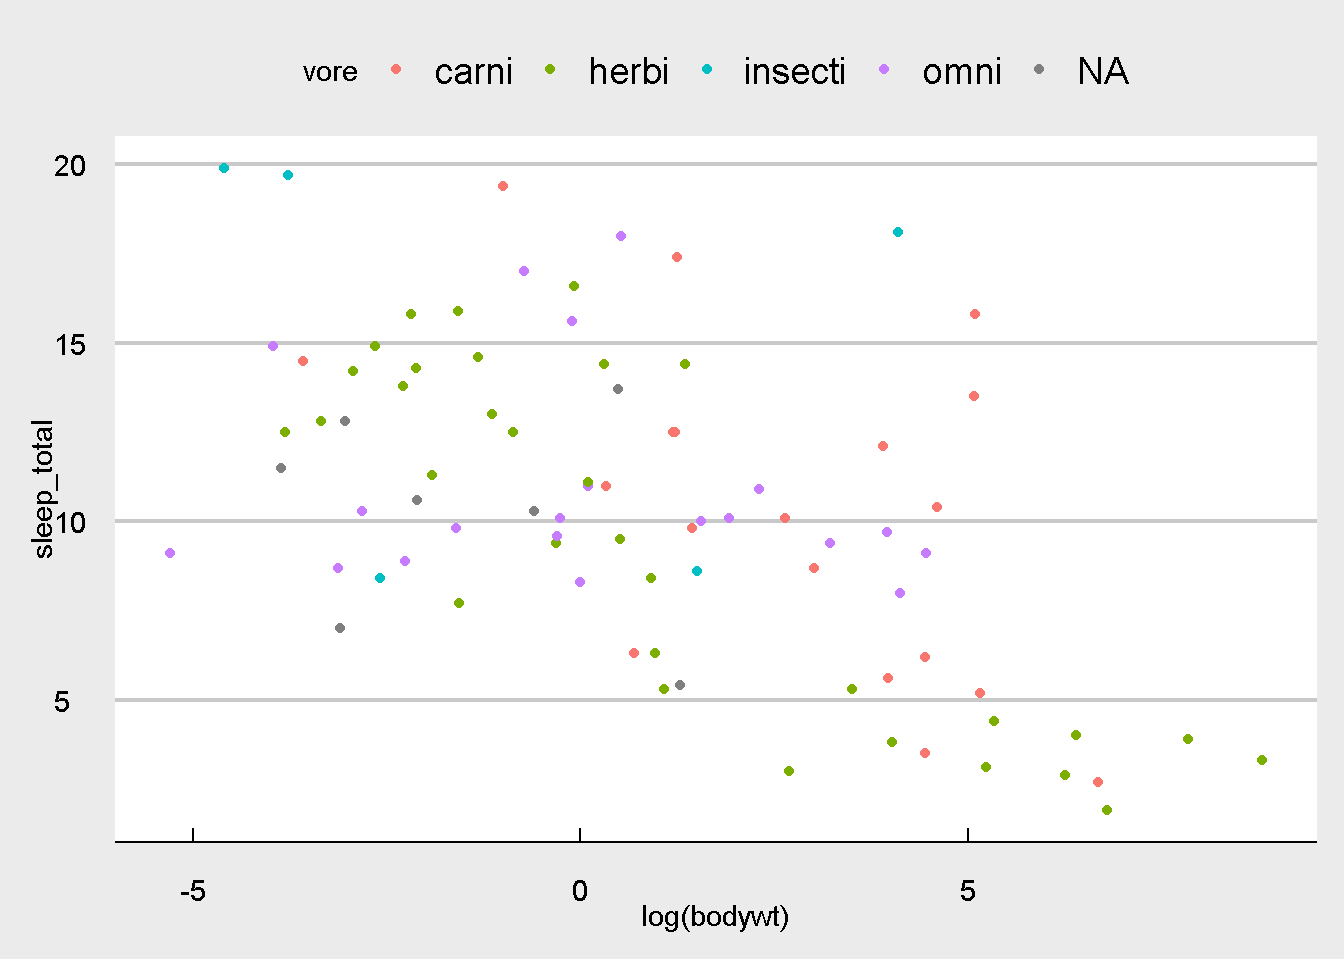
gg + ggthemes::theme_fivethirtyeight()
gg + ggthemes::theme_gdocs()
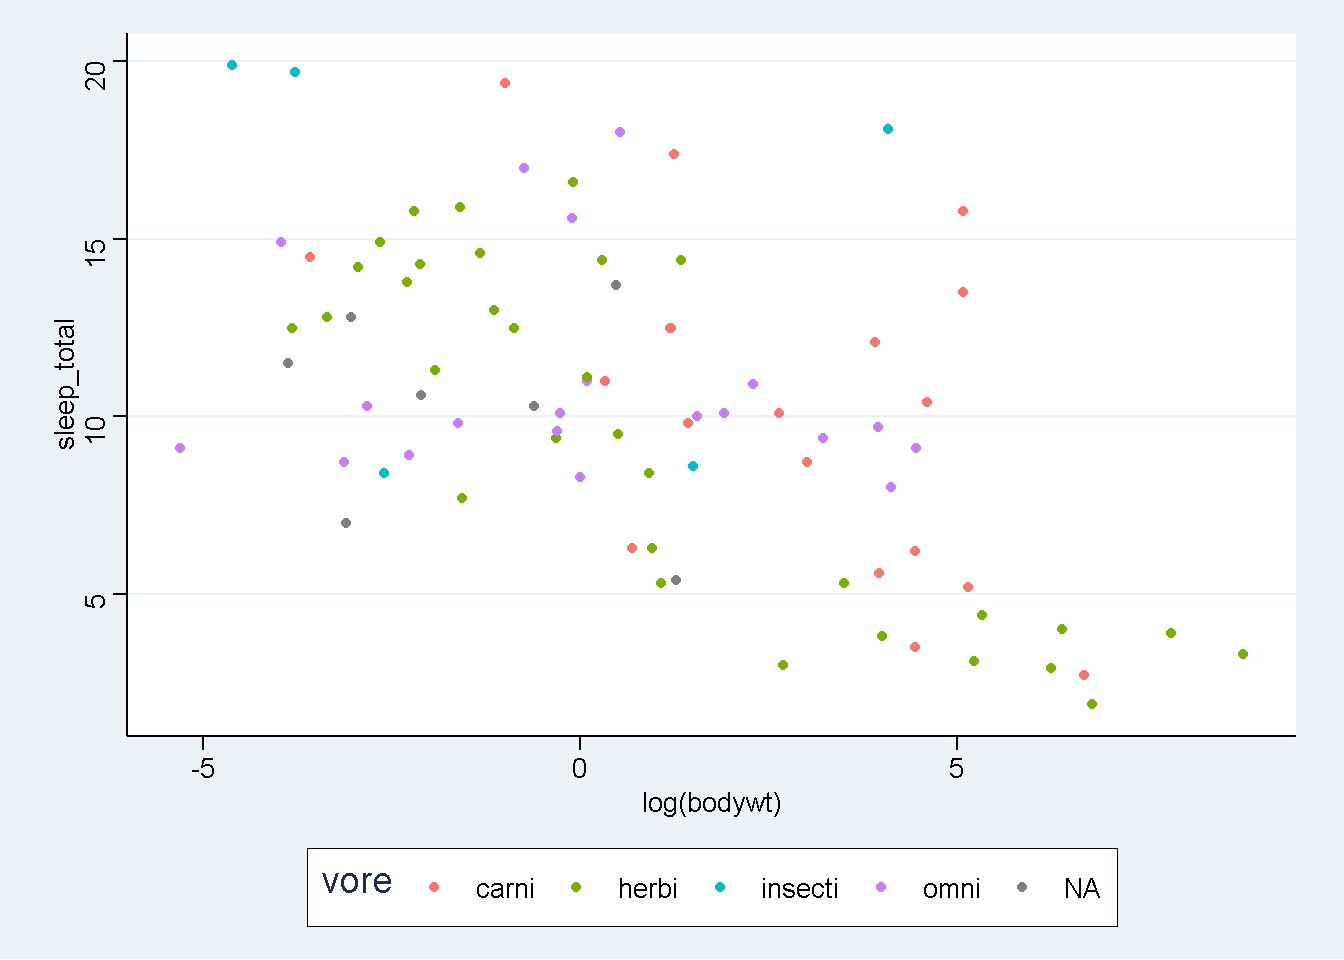
gg + ggthemes::theme_stata()
gg + ggthemes::theme_wsj() #Wall Street Journalとにたテーマ
以上、駆け足でしたが、「ggplot2で基本的なグラフを描けるようになる」を目的に解説してきました。残りのこのセクションの動画、追加でもう少しggplotを使いこなしたい人向けの解説になります。すこしややこしい話もあるので、現時点であまり興味がない人は飛ばしてもらってもよいと思います。
さらにggplotについて学びたい方は、脱初心者のためのデータ可視化コースを別に用意してありますので、そちらを見ていただけると嬉しいです。
ここまででも、ものすごい進歩です!
是非、自分で自分を褒めてあげましょう。
それでは次のセクションでお会いしましょう!