スライドで解説した内容を実施しましょう
── Attaching core tidyverse packages ──────────────────────── tidyverse 2.0.0 ──
✔ dplyr     1.1.2     ✔ readr     2.1.4
✔ forcats   1.0.0     ✔ stringr   1.5.0
✔ ggplot2   3.4.2     ✔ tibble    3.2.1
✔ lubridate 1.9.2     ✔ tidyr     1.3.0
✔ purrr     1.0.1
── Conflicts ────────────────────────────────────────── tidyverse_conflicts() ──
✖ dplyr::filter() masks stats::filter()
✖ dplyr::lag()    masks stats::lag()
ℹ Use the conflicted package (<http://conflicted.r-lib.org/>) to force all conflicts to become errors
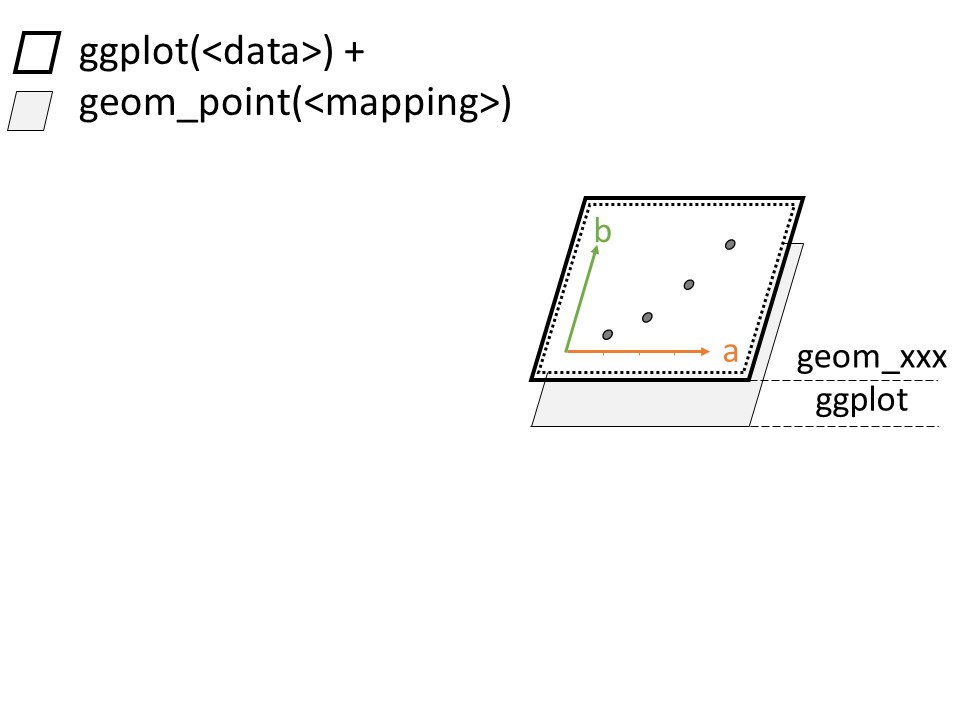
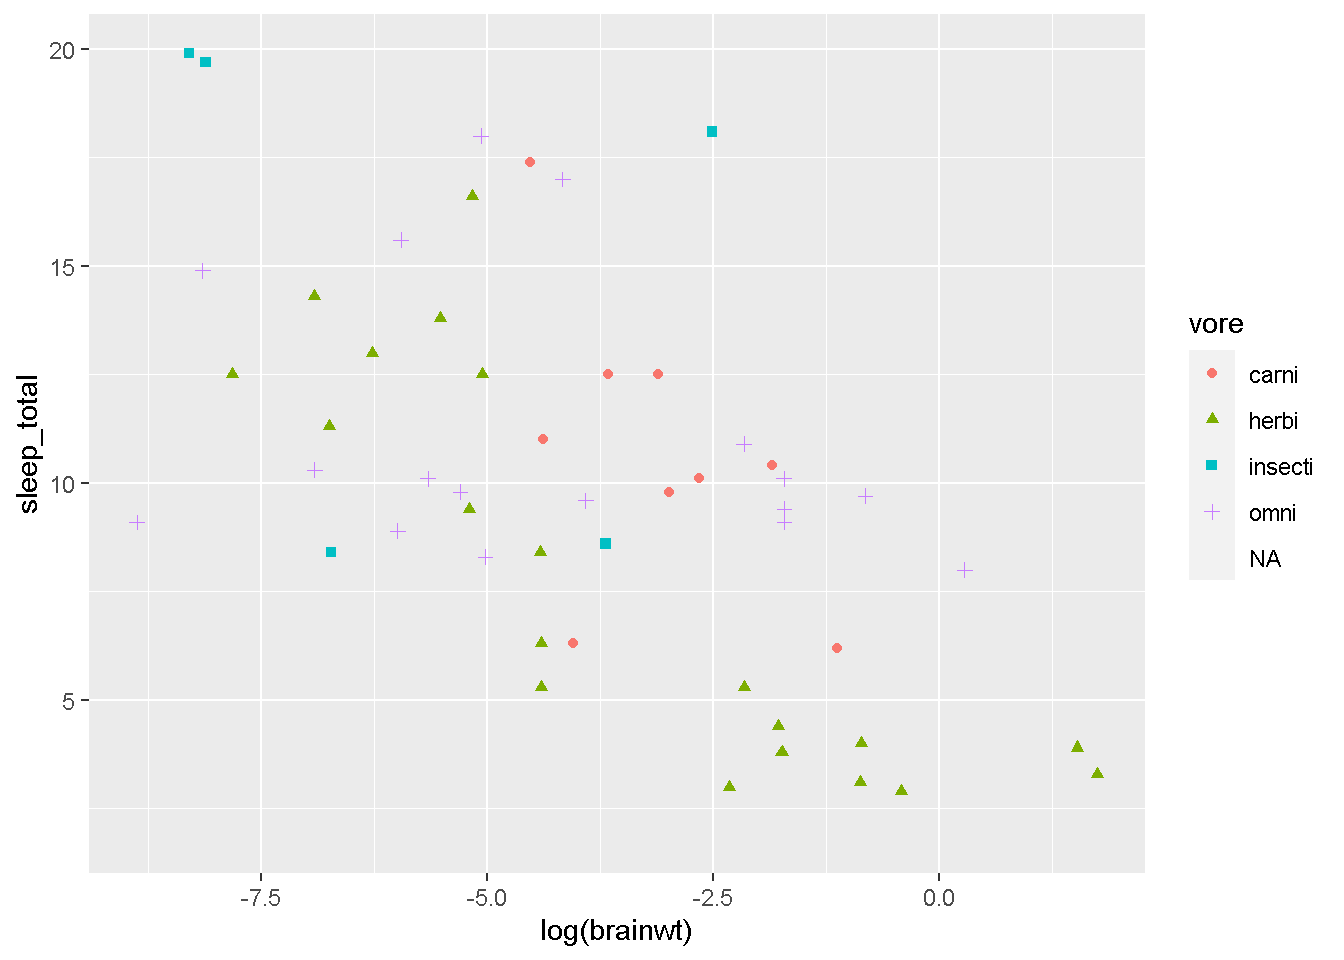
ggplot(msleep, aes(log(brainwt), sleep_total)) +
  geom_point(aes(shape=vore, color=vore))
Warning: Removed 32 rows containing missing values (`geom_point()`).
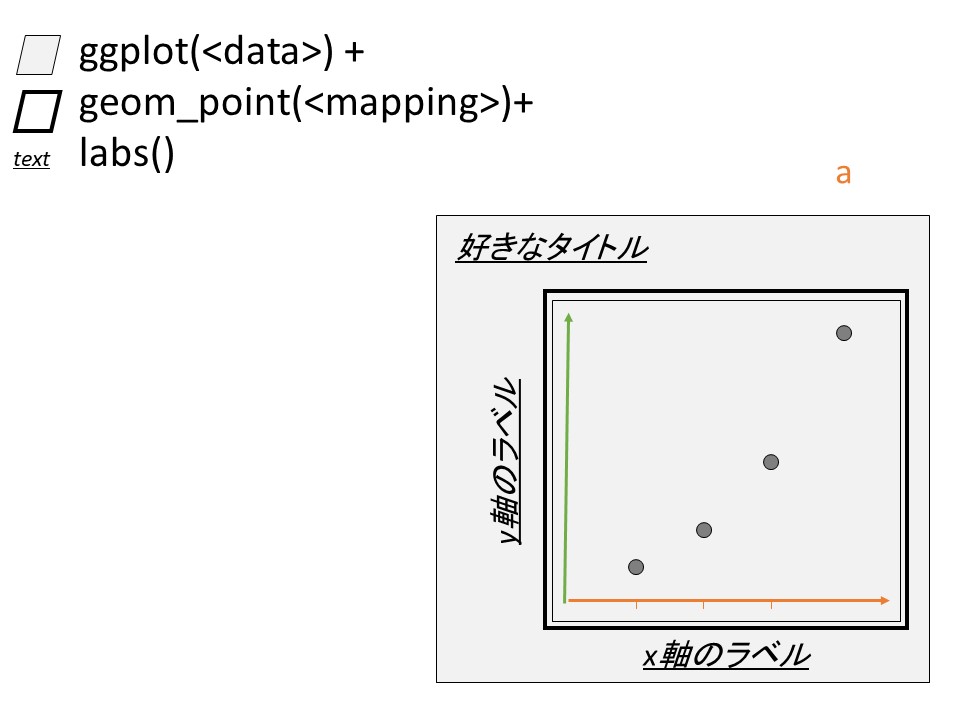
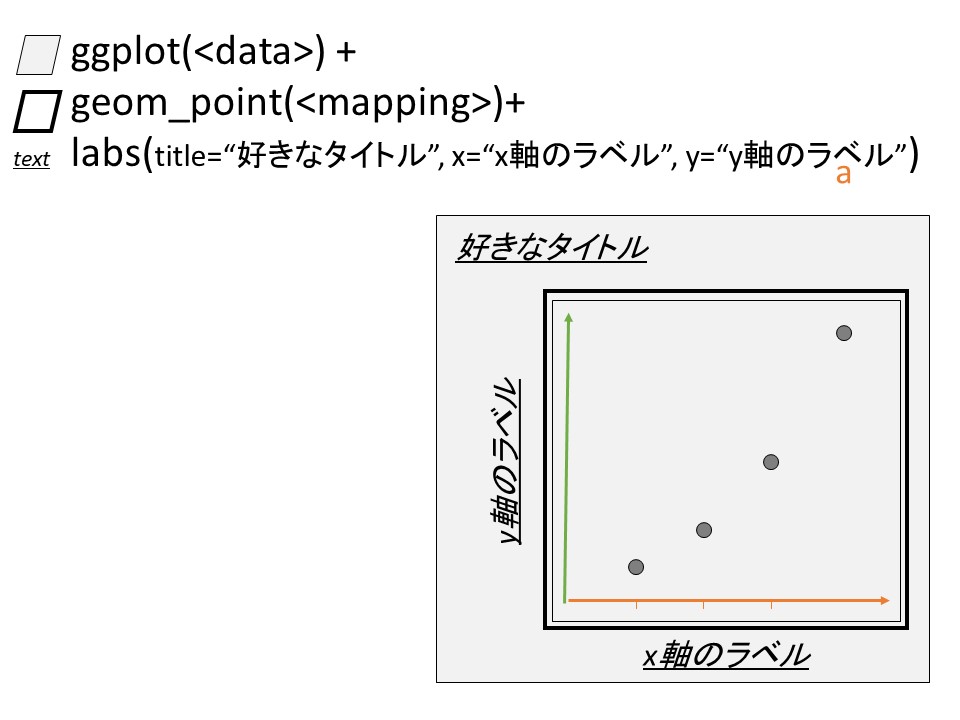
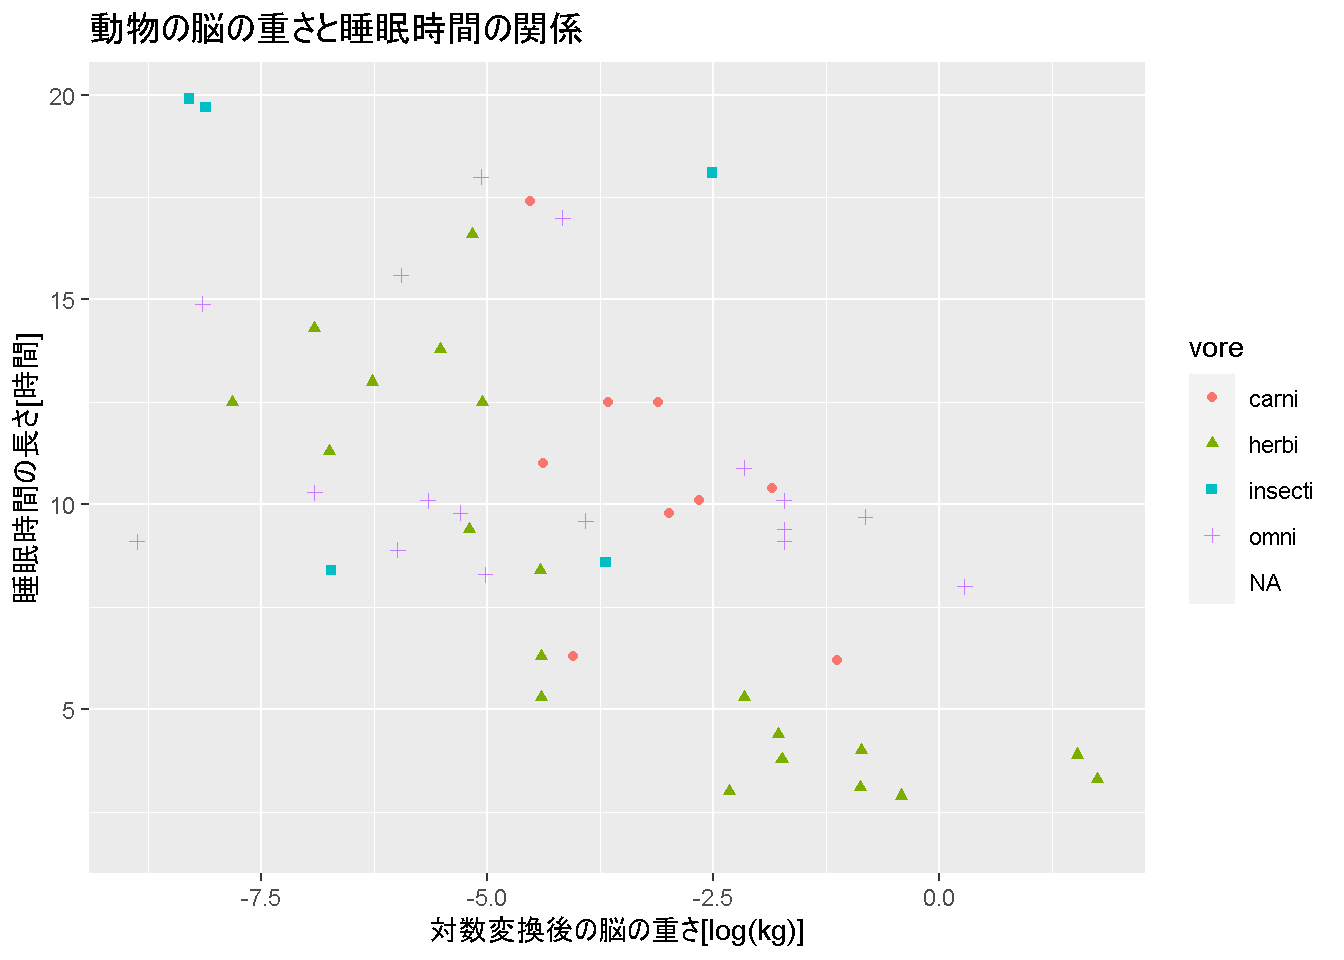
このグラフに、タイトル、x軸、y軸を設定していきますスライドの通り、
ggplot(msleep, aes(log(brainwt), sleep_total)) +
  geom_point(aes(shape=vore, color=vore)) +
  labs(title = "動物の脳の重さと睡眠時間の関係",
       x = "対数変換後の脳の重さ[log(kg)]",
       y = "睡眠時間の長さ[時間]")
Warning: Removed 32 rows containing missing values (`geom_point()`).
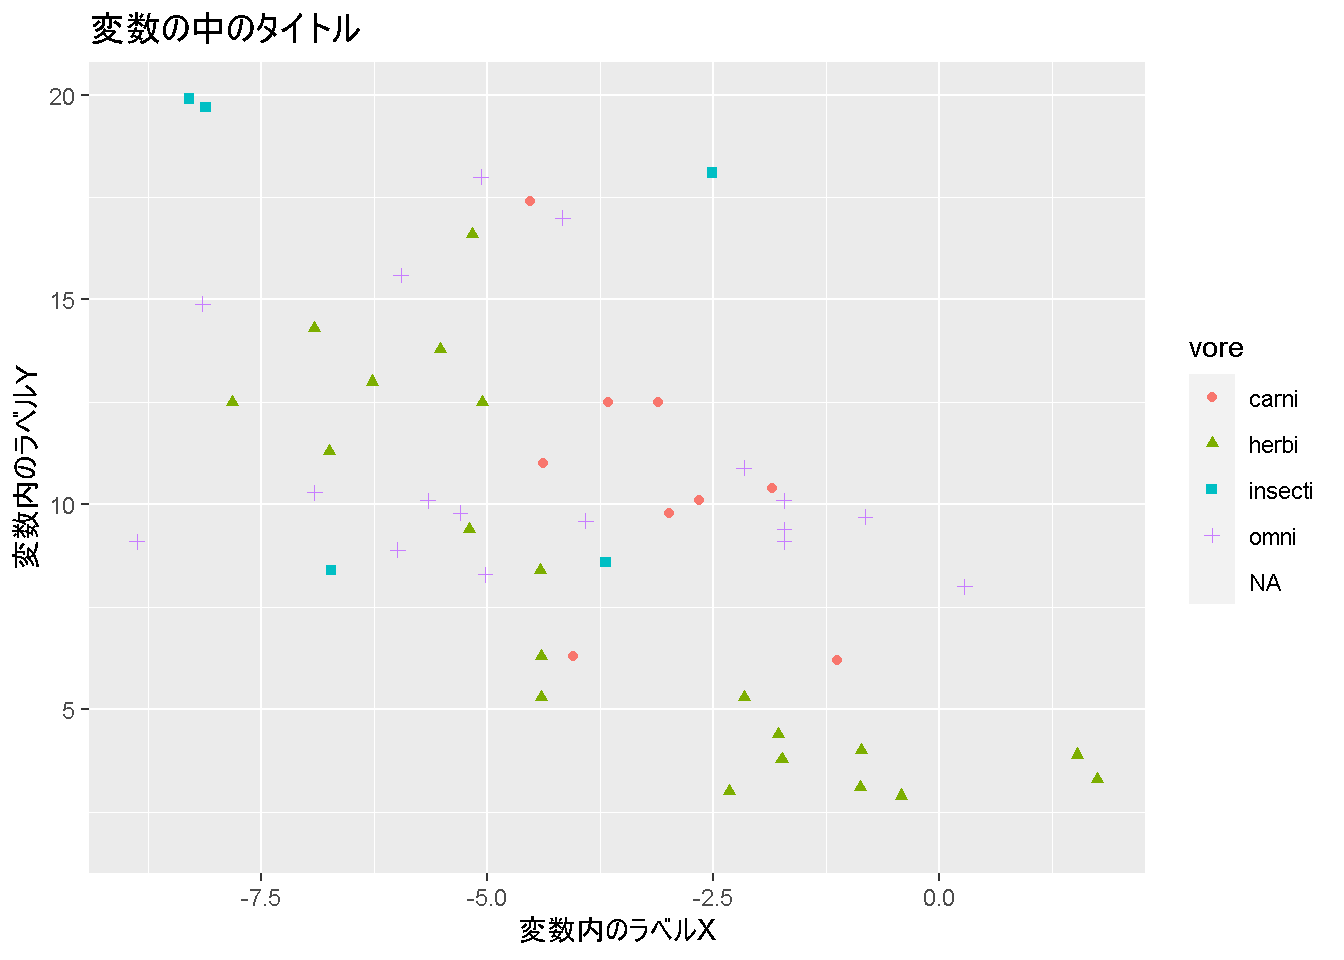
簡単ですね? もちろん、変数も使えるので、
title_text <- "変数の中のタイトル"
x_lab      <- "変数内のラベルX"
y_lab      <- "変数内のラベルY"

base_graph <- ggplot(msleep, aes(log(brainwt), sleep_total)) +
  geom_point(aes(shape=vore, color=vore))

base_graph
Warning: Removed 32 rows containing missing values (`geom_point()`).
こんな感じの基本のグラフに対して、
label_graph <- base_graph +
  labs(title=title_text, x=x_lab,y=y_lab)
labsでタイトル等をつけてあげて、
Warning: Removed 32 rows containing missing values (`geom_point()`).
こういう風に作成することもできました。いかがでしょうか?ここはそれほど難しくないはずです。
次は、凡例の設定について解説していきます。多分、ggplotでのグラフ作成で一番ややこしい部分かもしれません。