library(tidyverse)dat <- tibble(
age_group = c("~20","21~40","41~60","61~80","81~100"),
pop = c(13,20,32,55,20)
)こんな感じの、集計済みデータあるとしましょう。age_groupは集団の属する年齢、popは人数だとしますそれで、
dat# A tibble: 5 × 2
age_group pop
<chr> <dbl>
1 ~20 13
2 21~40 20
3 41~60 32
4 61~80 55
5 81~100 20ggplot(dat) + geom_bar(aes(x = age_group))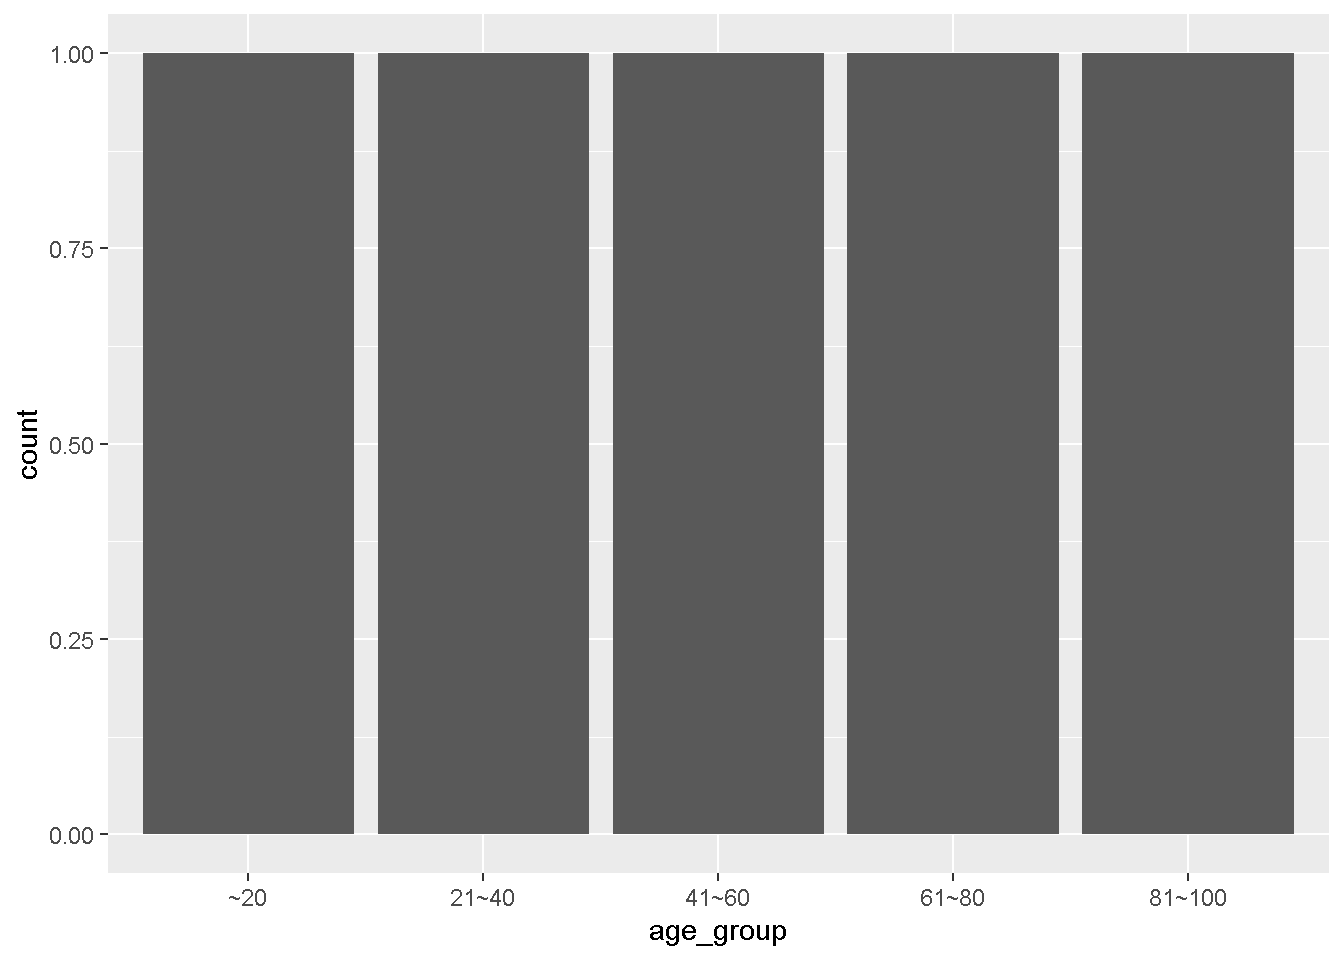
とすると、x軸のage_groupを集計して表示するため、それぞれの年齢は1件ずつとなり、y軸の値は集計された1件となります
ここで、geom_barに集計をさせない方法を考えてみます。y軸の値を与えてあげて、それを描画する方法です。単純に、y軸の設定をしても
ggplot(dat) +
  geom_bar(aes(x = age_group, y = pop))
Error in `geom_bar()`:
! Problem while computing stat.
ℹ Error occurred in the 1st layer.
Caused by error in `setup_params()`:
! `stat_count()` must only have an x or y aesthetic.xかy、どちらかしか設定できませんとおこられますが、
ggplot(dat) +
  geom_bar(aes(x = age_group, y = pop),
           stat="identity")
と、stat_identityとすると、集計をせずに描画してくれます。
これは、
ggplot(dat)+geom_col(aes(age_group,pop))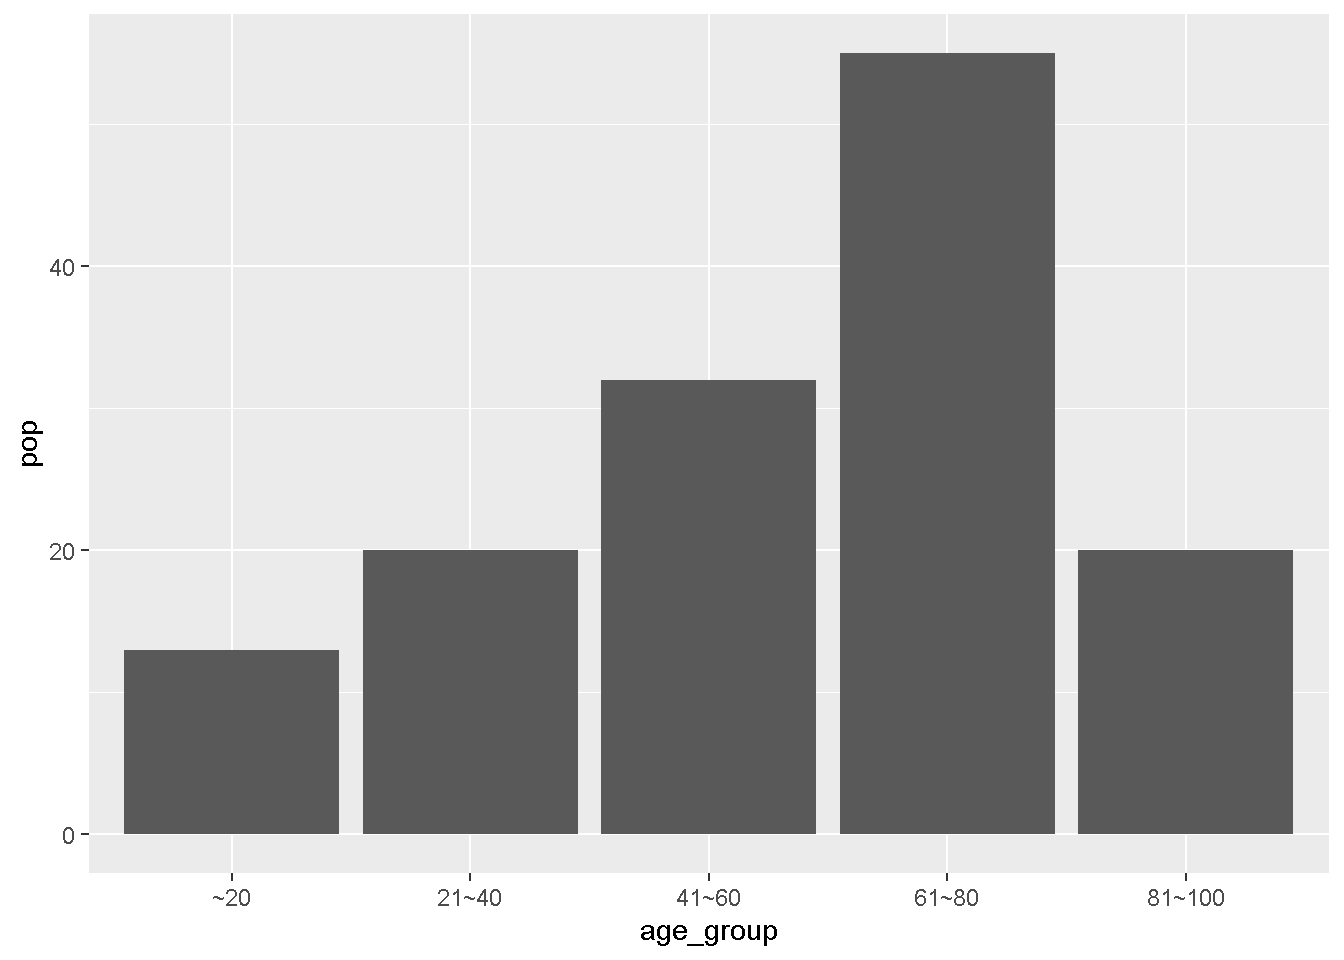
geom_colとまったく同じ挙動なのであんまり役に立たないかもしれないですけどね。